|
Data archiving is usually an integral part of every visualization
or the control system of any technological process. Data archiving
means in principle storing measured or calculated variables into data
files. Data archiving may of course incorporate tracking of historical
trends, state changes of tracked variables, alarms or failures and
also backup of important variables of the application. For each such
activity there is available either a special data section, an
attribute of a data element or a virtual instrument.
In the Control Web data is archived in standard
databases. The data in archive files are organized as a form of tables
where each individual table line represents one record and each
individual column one record item. Each item of a record is identified
by its name, type, and size.
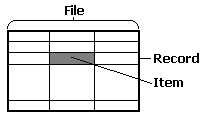
Database File Structure It is possible to archive data periodically on the basis of a
certain event (e.g. exceptions from the driver) or by calling of
native OCL procedures. When setting the archiving parameters, it is
possible to define not only the target database, but also the target
table (file) and the historical availability of data, i.e. to specify
the time period during which data will be stored in the database. The
archived data is recorded in the file by records and in a standard
manner the item with the time mark is added to each record that
uniquely specifies the time of gathering the value of the archived
variable.
The Control Web also offers a series of
possibilities and tools for reading and processing of archived data
from the databases. As has already been mentioned, data is archived in
standard databases and, therefore, is available for processing also in
other applications.
Archiving by using of archive data sections
The most natural, simplest, and practically a problem-free
manner of archiving in the Control Web is system
archiving by using of archive data sections
(archive sections). Archive data sections are
defined in the Data inspectors tab in the Data
elements item.
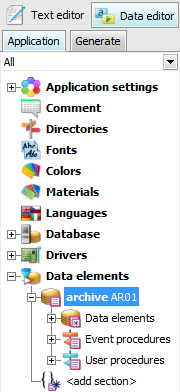
Archive data section definition Data elements located in those data sections are implicitly
archived into tables with the same name as the archive section.
The target database is described using the database
attribute, which contains the name of the identifier referring to
the parameter definition of the connection to the database. The
database connection parameters are defined in the Data editor of
the Database section.
If the section defines this attribute, the default database
will be used for archiving data elements.
If data elements are archived into MDB (the format used by e.g.
Microsoft Access),
this file is always compressed before application start for reason
of possible fragmentation of the database file. This operation can
last even several minutes, according to the database size. If you
want to prevent this activity, you can ban this operation in the
system data inspector.
Data elements in the archive section can be archived with the
frequency defined within the section or in the period typed
directly for the data element.
The following picture shows the definition of the Archive1
archive data section with the frequency of archiving of 5 seconds
that contains four data elements.
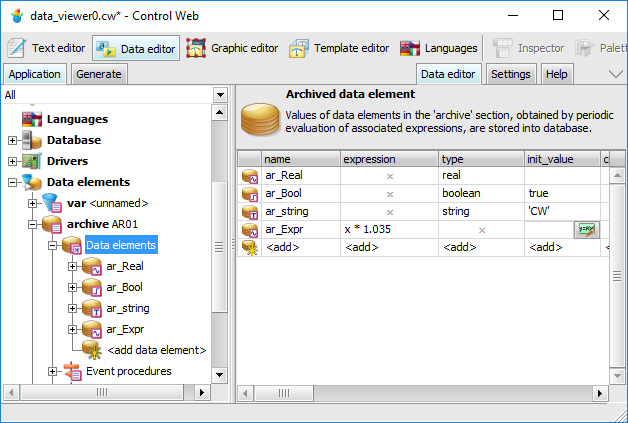
Definition example of data elements in the archive data
section Each archive data element must have a unique name within the
section, which is used for identification in the archive table. In
addition to the name of the data element, its value and type, the
archive table also contains the time mark — UTC time in the form of Julian date, zonal time
offset, and daylight saving time offset.

Example of the archive section data in the database
table All data archived by archive sections can be browsed in the
application of the Control Web by means of the
data_viewer virtual instrument.
Browsing the archived data
The data_viewer instrument is used for
displaying data stored by archive sections in the database files.
The instrument reads the data from files and displays it in the
form of a graph or table.
The data_viewer instrument can work in
two modes:
Before starting an application containing the
data_viewer instrument we must perform the basic
setting of the instrument parameters.
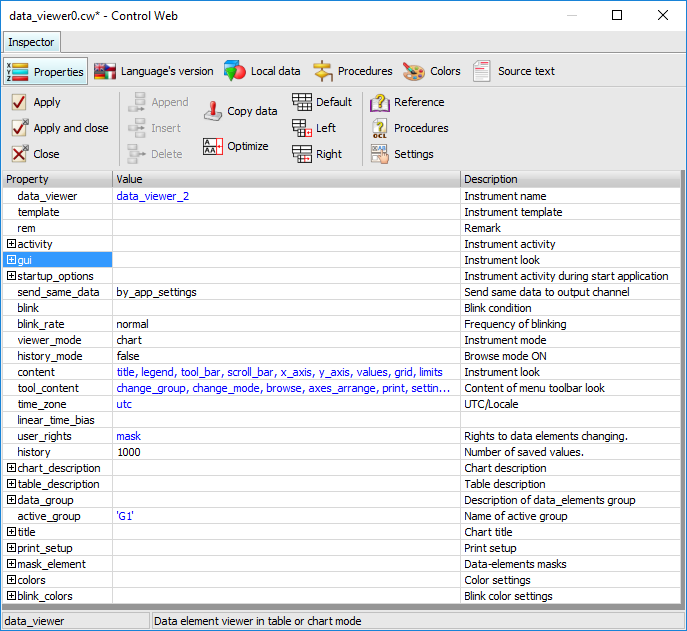
Instrument Inspector
data_viewer
In the Activity section set the period
parameter. This parameter specifies the time interval, in which
the instrument will require data from the database. It is necessary to specify which data is to be displayed.
It concerns data elements defined in some archive section. The
data_viewer instrument associates data elements
into logical groups and puts one of these groups into the graph
or the table. During the running of the application it is
possible to switch between groups. The groups are defined in the
data_group parameter. 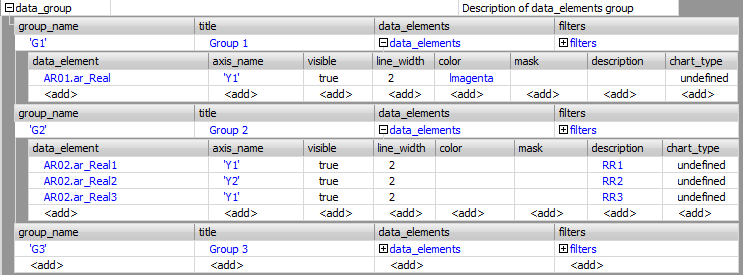
Definition of groups The following parameters must be set for each
group:
group_name — the
group identifier. This is the name uniquely identifying the
group. It is used e.g. for calling native
procedures. title — the text
describing the group. It is recorded in the graph
title. item — the list of
group data elements. Data elements are identified by the
full name, i.e. the archive section name separated from the
data element name by a period. At the place of the data
element name, there can be wildcards conventions for names.
The group name must be mentioned in apostrophes. Array data
elements cannot be incorporated into the group as a whole,
however, it is possible to type individual elements of the
array. For each data element it is possible to type the
identifier (name) of axis y axis_name, the
width of the graph line line_width and the
color by which the course will be drawn color.
The mask parameter defines the mask for
displaying numeric values of the element in the time cursor
information window and in the viewer_mode = table
mode. The description parameter defines the
text string describing the data element in the graph legend
and in the time cursor information window in the viewer_mode = chart
mode. Setting parameter active_group — the name of the group that will be drawn after
starting the application. Definition of the time axis of the graph. The time axis
is defined in the time_axis sub-section of the
chart_description section. 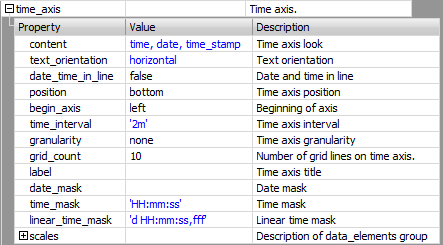
Definition of the time axis
content — the time
axis description content text_orientation — text orientation of axis caption date_time_in_line — the parameter value here defines, whether date
and time captions will be written adjacently (parameter set
to true) or consecutively (parameter set to
false) position — the
time axis position time_interval — the time axis length begin_axis — the
time axis beginning granularity — defines the alignment of the beginning of the
time axis to full seconds, minutes, hours or days. grid_count — defines how many sections the time axis will
be divided into label — the name
of the time axis date_mask — the
mask for displaying date on the time axis. If the parameter
is not defined, the date is displayed in the format
specified by the MS Windows
setting. time_mask — the
mask for displaying time on the time axis. If the parameter
is not defined, the time is displayed in the format
specified by the MS Windows
setting. scales — a list
containing predefined lengths of the time axis Definition of the y axis (or axes). The axis is
defined in the axis_element parameter in the y_axes
sub-section of the chart_description
section. 
Definition of axis y
name — the axis
identifier. This is the name uniquely identifying the axis.
It is used e.g. for calling native procedures. visible — defines
the visibility of the axis. States whether the axis should
be drawn. label — the text
description (title) of the axis. units — the
dimension of the value. sheet_title — sheet title. scale_type — defines the type of the axis scale. The axis
scale can be logarithmic or
linear. number_format — the format of writing numbers in the axis
label (decimal or semi-logarithmic format). The
semi-logarithmic format can be written in scientific or
engineering notation. precision — the
number of displayed decimal places in the scale
description. range_from — the
lower limit of the scale. range_to — the
upper limit of the scale. auto_range — enables automatic adaptation of the high_value
and the low_value border of the axis according
to values of displayed data elements low_limit — the
lower limit value high_limit — the
upper limit value major_incr — the
main step of the raster. minor_incr — the
minor step of the raster. Definition of the instrument mode. The viewer_mode
parameter determines in which form the data will be displayed.
The instrument can work in two modes: If in the instrument appearance definition (the content
parameter) the graph title is defined, it is necessary to set
its parameters. Each title may contain up to three lines of
text. For each line it is possible to set a different font and
color of the text. It is possible to define the title
transparency, the title frame, and the background color. The
title parameters are defined in the title
section.
As soon as all the basic parameters are set, it is possible to
run the application.
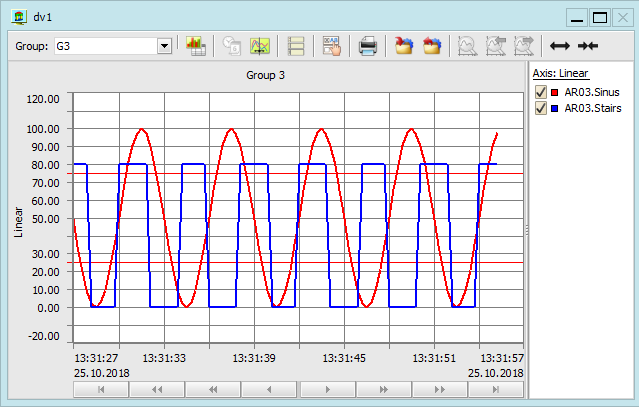
Instrument in mode chart Switching between modes can be easily performed by pressing
button  . .
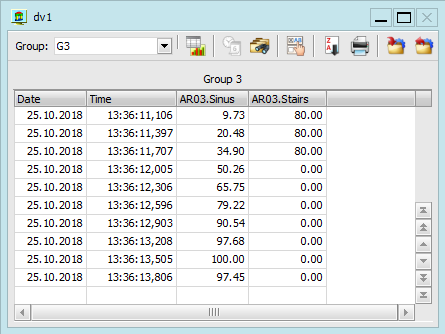
Instrument in mode table The number of displayed values in one instrument is not
restricted. When the application is running it is possible to
switch between the displayed groups and to switch the display of
each monitored course on or off. In the chart mode it
is possible to change the displayed time interval, the number of
grid lines in both the horizontal and vertical direction, the
calibration and the y axis range at any time. In the
“offline” mode it is possible to read values by means of
the time cursor.
Summary
Archive data sections are used for archiving. Data is stored in database files. Archived data can be browsed in the application by means
of the data_viewer instrument.
|