|
The application of the Control Web runs in the
technology in Control Web Runtime — the version of Control Web that is
designed to support the application at runtime. What is sufficient for
running is insufficient for comfortable design, development, and
debugging of the application. Therefore, there is the Control Web development version, whose tools and application editor
enable creation of control and/or visualization application
programs.
Which principles of creation of the application can be
found in the Control Web?
Composition of basic units into larger units. Simple
components (with rich properties) form functional blocks, the
functional blocks form an application module, and the application
modules may (but need not) form a secure redundant distributed
system. Uniform setting of parameters of objects
(instruments and data) by a simple table editor. The table form of
displaying and editing of properties has the unique ability to
display all aspects of the element at once without wasting time with
a lot of buttons, windows, tabs and lists. Regular availability of information — even if it is documentation or a summary in the actual
setting of objects. You will find Help at all levels of
editing. Possibility of selecting the way of settings the
parameters. If the colors are to be modified, you select either the
color editor or the color table (with parameters), if you modify an
instrument, you select either the parameter table or source text
editor.
Such easy editing of the application is possible in the
Graphics Editor that is the main space for creation in the
Control Web. Nevertheless, because the application in
the Control Web is stored in the text form, you will
also meet the text editor. Both editors, graphics and text, cover a
deeper duality of approaches to the creation of an application in the
Control Web; at present it is sufficient to know that
such a text editor exists.
The graphics editor is offered in the development environment by
default after the installation of the Control Web. It
is possible to switch between text and graphic editor using a pair of
tabs.

Main tabs of the development environment If the graphics editor is not activated (its tab is not selected),
it is activated using the mouse by clicking its tab.
Application composition workspace
It is possible to imagine the graphics editor as a container
which is filled with building elements from the offer, where each
such element can be repeatedly modified without restrictions. The
offer summarizing all present building elements is called
Instrument Palette. The instrument palette is opened by
a button in the tool bar

Tool bar with button to open the instrument
palette 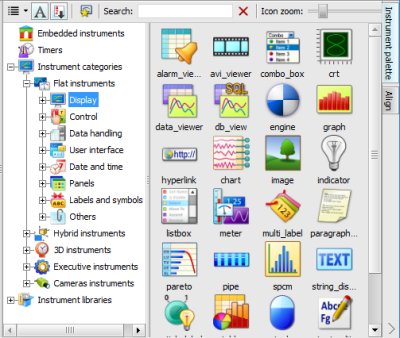
Instrument Palette Instrument Palette
The Instrument Palette is a fundamental part of
the development environment, therefore, it contains a lot of
information. First of all, the palette is divided into the
left part with instrument categories displayed in tree and the
right part offering individual instrument classes. The left
part (tree) offers two ways to organize components
(instruments) — it is possible to choose
the preferred view using the combo-box above the left
pane.

Combo box with the option of a view of
instruments The following views are offered:
Instrument categories, a view created
according to the importance and the function of individual
instruments. Instruments of similar functions are grouped
into categories, inside these categories instruments are
sorted according to imaginary complicacy. Because the
Control Web offers two principally
different manners of visualization (2D and 3D), two of the
main categories are Flat instruments and
Spatial Instruments. Executive instruments
are all instruments that are not visible (they do not serve
for visualization), System Instruments are
internal instruments and instruments used only for calling
system functions. Instrument libraries, a view constructed
according to the classification of instruments into program
libraries.
The right part of the instrument palette summarizes
individual instruments.
The left part of the selection palette influences the area
with instruments, the more submerged you are in the tree, the
more precisely the group of instruments will be restricted
and, therefore, the area will contain a smaller number of
(exactly specified) instruments. In the end, at the level of
one highlighted instrument in the tree of the palette, a quick
display of possible appearances of instruments (if the
instrument offers them) will be offered in the area of the
instrument.
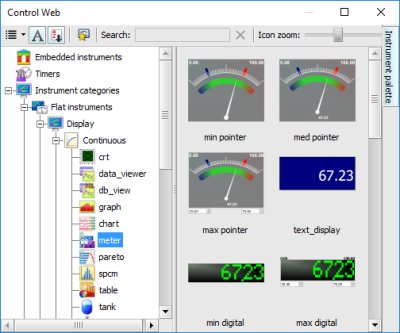
The palette with the meter
instrument selected in the tree and its forms in the area of
the instrument Views with possible appearances of instruments can also be
displayed faster — it is enough to
double-click the selected instrument in the area with
mouse.
Selection of a suitable instrument by means of the palette
is the first step (often repeated) for the creation of an
application. After it, there is the second step, which is
inserting the new instrument into the application. This
operation in the Control Web is
direct — by dragging the mouse. It is
enough to click on the selected instrument and drag it into
the suitable place of the graphics editor.
Graphics Editor is a target for
instruments
There are several suitable places for the dropping of a new
instrument in the graphics editor. In particular, it is always
possible to drop the instrument in the area of the visual
editor.
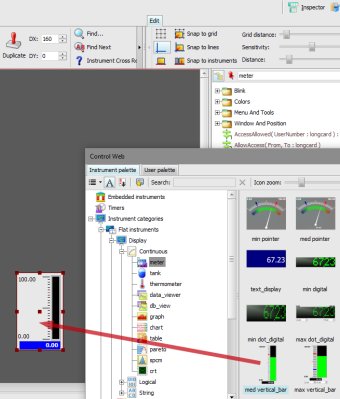
Dropping of the instrument in the area of the
visual editor Of course, you can drop in the visual editor only
visible instruments, if you try to drag from the
palette into the visual editor, for example, the
program instrument the Control Web will prevent it by notification of error:
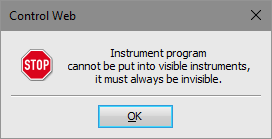
Incorrect insertion of the instrument into the
visual editor Another (second) suitable place where it is possible to
insert a new instrument are trees with instruments. In the
Graphics editor, trees with instruments are located
on the left or right beside the visual editor (depends on the
setting of the development environment).
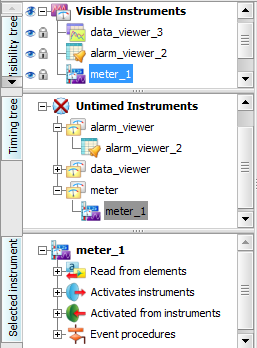
Instrument Trees It is possible to insert into the tree
Visibility or into the tree Timing
either into one of the roots (Visible,
Invisible, Timed, Not timed),
into some of the node instruments (panel or
timer), or behind an already existing instrument. All these
possible insertion positions of the instrument are displayed
in the development environment by highlighting.
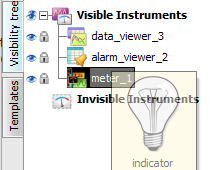
Marked target of insertion of a new
instrument. The development environment does not allow to insert the
instrument to an incorrect place, nevertheless, some checking
is performed at the moment of release the mouse button (at the
moment of dropping of the dragged instrument). This may also
cause an error.
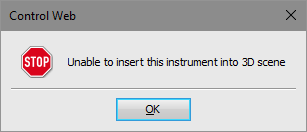
Insertion of a new instrument into the incorrect
panel The last tree Selected Instrument cannot be used
for insertion of new instruments because the tree only
displays details of already existing instruments.
Editing in the Graphics Editor
Each newly inserted instrument is automatically selected by
the selecting frame (it is the default behavior of the
development environment that can be modified). This is because
of the fact that only a selected instrument can be modified
and edited. In addition to such an automatic selecting of
newly inserted instrument, it is possible to modify any other
instrument if it is selected.
In the development environment it is possible to select the
instrument directly (by mouse) or indirectly (during editing
using hotkeys). Selecting of the instrument by mouse is easily
carried out by clicking either in the visual editor (on some
instrument) or in the tree (again on some instrument). If you
click by mouse outside the instrument, the selection is
canceled. If during selecting in the visual editor in addition
to clicking by mouse on another instrument you press the
<Shift> key, the development environment will select
this instrument additionally. Both instruments will
be selected, i.e. the group of instruments will be
selected. It is possible to select an arbitrary number of
instruments and, moreover, if you click (while holding the
<Shift> key) on an already selected instrument, the
selection is canceled.
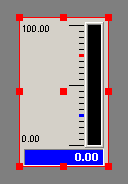
Instrument selected by the selection
frame The selected instrument is automatically highlighted where
it is useful. For example, the instrument selected in the
visual editor of the development environment automatically
highlights also in the instrument trees and vice versa.
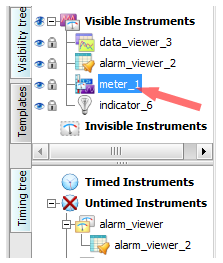
Instrument selected in the instrument
tree The instrument (or the group) selected in this way in the
visual editor can be arbitrarily relocated or enlarged or
minimized by mouse (or keyboard). In this case, it is always
necessary to drag the selection frame at some of the dragging
points. Using the keyboard (by means of cursor arrows), the
selecting frame (and the instrument) can change only the
position (not size).
Each selected instrument (or group) can be arbitrarily
modified by hotkeys or by means of the main menu of the
Control Web or by means of the context menu
which is opened over the selected instrument when clicking
with the right mouse button.
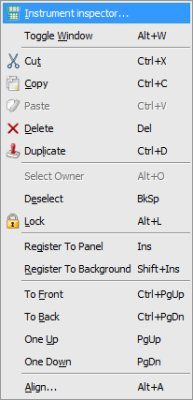
Context menu Operations by means of the context menu are easily
accessible. The first item of the menu is for the
Control Web crucially important. The
Instrument Inspector is the basic way to modify the
properties of instruments.
Instrument Inspector
The instrument inspector is a uniform tool which modifies
the properties of any instrument. Its functions are divided
into independent tabs.

Tabs of Instrument Inspector Each tab offers for a modified instrument (or group
of instruments) a slightly different viewpoint. The
following tabs are important. | Properties | Probably the most used tab. It offers a view in table
form (in hierarchically sorted tables) of all data of the
instrument. It is possible to open and close tables (by
clicking on plus and minus signs) and edit them by clicking
on the fields of the table. 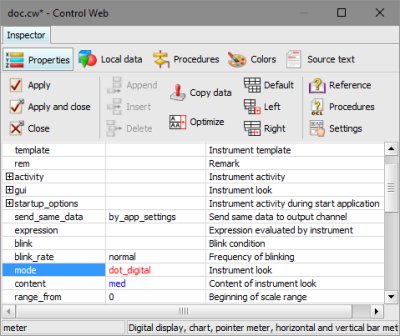
The Instrument Inspector in the tab
Properties The inspector automatically distinguishes
the states of parameters by colors, so parameters are
displayed in three colors: black (indicates the default
value of the parameter that always has some value), blue
(indicates the parameter that has the value other than the
default), and red (indicates the parameter that was changed
during the currently performed changes). Not filled
parameters (the column Value is empty) are not
defined in the instrument. Parameters which may repeat
in the instrument (for example, they define more courses of
graphs) are displayed by the inspector also in the form of a
table, however, this table has the last row indicated by an
asterisk and cells in this line are prepared for adding a
new item (in <add> cells). If values are
written in such a line, the inspector automatically creates
a new item of the parameter (and prepares a new empty line
by adding the next new item). 
Table of repeated parameter with the last line
prepared for adding a new item The inspector offers for editing of most
parameters a special editor, so it is not necessary to edit
data directly in the active selected cell. The parameter
editor is opened by means of the drop-down button located in
the right edge of the edited cell and is closed (with
confirmation or rejection of changes) by means of buttons in
the right upper corner of the parameter editor. 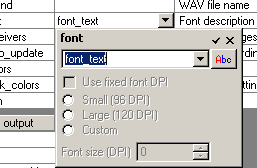
Editor of parameter font By the way, the principle of confirmation or
rejection of changes uses the Instrument
Inspector as a whole (see the next text of this
Chapter). | | Colors | Tab used for coloring of the instrument. Each
instrument allowing coloring offers its colors in two sets
in tabs Normal and Alternate. The sets
of colors in both tabs are identical and differ only by the
moment of use — normal colors are used
if the instrument is not blinking, alternate colors are used
if it is blinking. 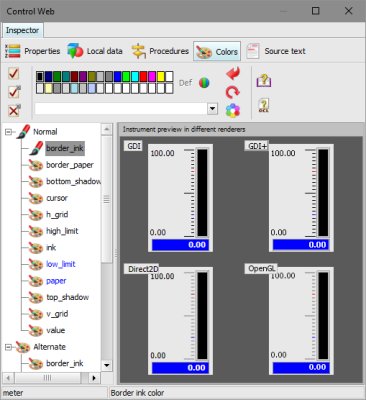
Instrument Inspector in tab
Colors Clicking the color (in any list) shows this
color in the palette: 
Selected color On the contrary, modification of the palette
of colors (either by simple clicking on visible colors or by
definition of colors by means of functional buttons)
automatically results in the change of the color selected in
the list. | | Source text | The tab offering a comprehensive view of all set
parameters and procedures of the instrument. In the editor
inside this tab it is possible to modify the instrument, the
disadvantage of editing of the instrument in this tab is
that not all (i.e. not defined) parameters are
offered. 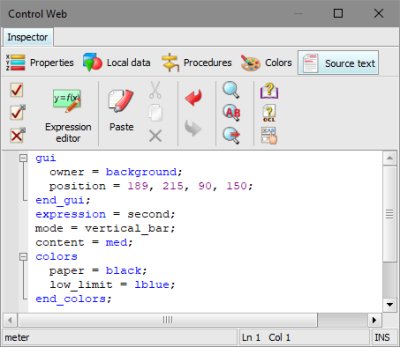
Instrument Inspector in tab
Source text |
All modifications performed in the inspector remain
prepared up to the moment of their confirmation. As was
described above, such prepared, not yet confirmed parameters
are drawn by the inspector in red. As long as modifications
performed in the inspector are confirmed, they are not
reflected in the edited instrument. Therefore, it is possible
to reject any modifications. In the Instrument
Inspector the buttons in the tool bar serve for
confirmation (use) or rejection (closing).

Bar Instrument Inspector, buttons
Accept, Accept and Close and
Close It is possible that during the modification you type some
of the parameters incorrectly (for example, you mistype in the
name of the variable). Such an incorrectly typed parameter
(and therefore whole instrument) cannot be used, so the
inspector prevents its accepting by error message, and, at the
same time, the list of all ascertained errors is displayed in
the bottom part. The list of errors is active and after double
clicking on some line (or pressing the <F4> key) the
inspector selects the cell in which the error is located.
After the correction of all errors it is possible to accept
all the modifications again (and the inspector can find the
other possible errors).
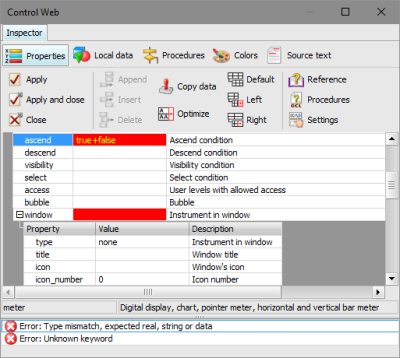
Instrument Inspector with the list of
errors So, all instruments in the application of the
Control Web are modified in a uniform manner
by means of the Instrument Inspector — the right mouse button, by means of the context
menu the inspector above the instrument is opened, necessary
actions are performed in the inspector and in the end these
actions of operations can be “accepted” and reflected
back in the application. It is simple.
Data editor
The application (and the instruments in it) needs to achieve
technological data (either for the demands of visualization or for
the demands of control). Similarly, somewhere it needs to store
the calculated states and internal values. Therefore, it is
necessary that some data in the application and in the
Control Web are represented by various types of
data elements. There are many data elements, but all data
is defined and modified in a uniform manner. However, since in the
Control Web there are data elements of various
levels (global, instrument and procedural), they are edited at
various levels (in a uniform manner).
Global data elements, i.e. elements which are visible and
accessible for the whole application and all its instruments, are
modified in the main tab Data Inspectors of the
development environment.
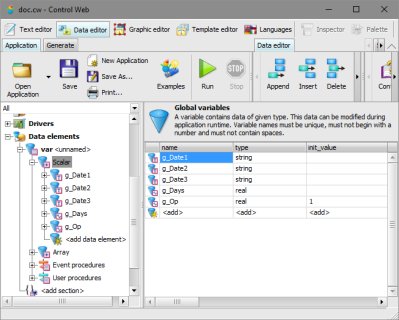
Tab Data Inspectors Similarly as in the case of the palette with instruments,
Data Inspectors are divided into a left part (with a
tree) and a right part (with editing tables). The tree contains
all available settings of the application (including system
parameters, user rights, etc.), but at now only its branch
Data Elements is interesting for us.
The sub-tree Data Elements summarizes all sections
(data elements are in the Control Web associated
into sections), and it is possible to expand each node in the tree
up to the level of an independent element (of course, if in the
application no elements are defined, there is nothing to expand in
the tree). The tree with elements can be edited, so the basic
operations with elements (adding, removing or renaming) can be
done by means of the context menu (it is opened after clicking
with the right mouse button). It is also possible to add a new
element in all places of the tree where <add data
element> or <add section>.
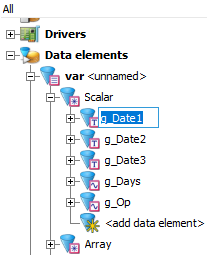
Editing of a data element in the tree It is possible to narrow the structure of the tree (similarly
as in the palette of instruments) by the combo box in the title of
the tree. Using the option All it is possible to
display the original, all-containing tree.
Let us point out that when you select individual levels in the
tree, you modify the appearance and the content of the tables in
the right part of the editor. The tree and tables correspond to
each other — for example, if Data
Elements are selected in the tree, the table contains an
offer for quick adding of all types of elements, if a section is
selected in the tree, the table contains the properties of the
section.
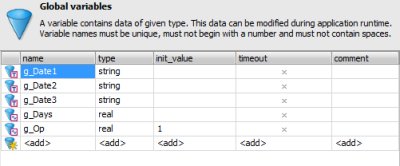
Table with the list of data elements of the
section Properties of data elements (attributes) are defined and
modified in a very similar manner to parameters of
instruments — by mouse (or keyboard by means
of cursor keys or with pressed key <Alt>) you select the
cell and modify the parameter in it. Here, the development
environment offers editors for comfortable editing of some
parameters. Compared with the instrument inspector, in the data
inspector the moment of use of the modified parameter is
different — whereas the instrument inspector
overwrites the modified setting to the instrument at the moment of
pressing the Accept button, the data inspector uses the
modified setting at the moment after leaving of the editor in the
cell (for example, if you click by mouse on another cell). If you
want to abandon already performed modifications (and you do not
want to reflect modifications in the parameter), it is possible to
terminate editing (not to use it) by pressing of the
<Esc> key.
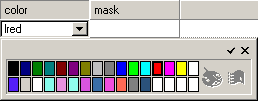
Editor of the attribute colors of the color data
element Removal of the data element is possible in two ways — either by means of the context menu in the tree or
by means of the button  in the
toolbar. in the
toolbar.
Association of data elements into sections is in the
application of the Control Web a very powerful
tool which you can see in the next text of various chapters. In
this place it is possible to mention at least the basic
principle — what is common for more elements
should be associated or separated at a higher, common level into
the data section. Example — if you connect a
group of channels to one PLC, it is good to create for such a
group (or PLC data block) a data section and to indicate common
properties ( e.g. driver, direction or
timeout) only in the data section. It is not
necessary to set these parameters for individual elements inside
the section because the elements take them from the setting of the
section.
Such taking of the value of parameters (attribute) of the data
element is in the table of the data inspector well evident because
the value of such a parameter is drawn in gray.
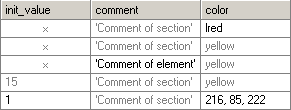
Example of parameters taken from the setting of the
section So the use of data sections:
simplifies the orientation (in one place it
manages to modify at once the properties of all nested
elements) minimizes the code of the application (common
parameters are written only once in the section and they are not
reproduced into each individual element) increases the security of the design (one
definition of parameters contains fewer errors than one
definition repeated and reproduced by hundred times)
Documentation
As has already been mentioned, documentation in the development
environment is available in several places, always according to
what is offered at the moment or what is being worked with.
The other two ways of opening the documentation are offered by
Instrument Inspector and the development environment
itself. Documentation opened by the inspector always concerns a
currently modified instrument, and for easy orientation it is
opened only in the form of the text of documentation (without
other control elements). Of course, if you start to modify another
instrument and you open from the inspector its documentation, a
new window is not opened, only the content of the already
displayed window is replaced. For the opening of the documentation
of instruments from the inspector, buttons in the tool bar are
used, one for jumping to the description of parameters and the
other for jumping to the description of instrument procedures. The
shared window with instrument references remembers its position
and size, so in the case of repeated use it is opened in the
position you left it.

Buttons of the inspector for opening of instrument
reference 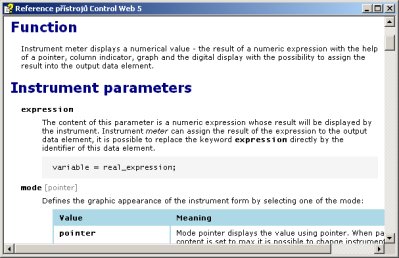
Reference description of the instrument in the
independent window The development environment, covering all development
possibilities, offers complete documentation (including
documentation for spreadsheet InCalc).
The documentation is wide-ranging, so the menu
of the development environment offers several fast options for
various parts of the documentation (including contents and
index).

Menu of the development
environment. In addition to the last two commands in the menu, there
are all references to the documentation and some of them
directly open the document, the others set the control tab in
the window with the documentation:
displays the tab Contents, it does not open
any document opens the document with reference description of the
development environment (hotkeys, etc.) displays the Search tab, does not open any
document or dialog window displays the Index tab, does not open any
document opens the document covering references to instruments
(list of individual instruments) opens the document covering references to drivers
delivered with the system (list of individual drivers)
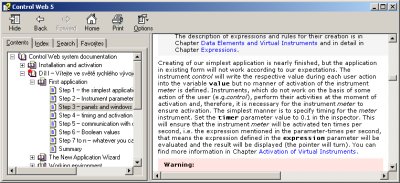
The window with documentation, which is opened by means of one
of the described commands, has more information than the window
with the instrument reference. This relates to extended
options — you may create a favorable tab,
globally search in all texts of the documentation and, of course,
print.
The component which is used for display of the documentation in
the Control Web (described windows with
documentation) is not part of the Control Web, so
its appearance (and also language) may change according to the
version of your operating system. For example, it is probable that
in the English operating system windows with documentation will be
in English.
Window with documentation Summary
Applications of the Control Web are
developed in the Graphics Editor of the development
version. The Graphics editor is divided into
individual areas and tools. All available components —
instruments are offered in the Instrument Palette
from where they are dragged by mouse into the
application. All instruments in the application are modified by means
of Instrument Inspector. Modifications performed in
the inspector are reflected in the instrument at the moment of
their use. For typing and modification of data elements, Data
Inspectors are used. To simplify recording and increase
orientation in applications, it is recommended to use data
sections.
| 